Vincent Gable’s Blog

November 11, 2009

Just Look at it, Man!

Filed under: Bug Bite,Programming | , , , , , , , , ,
― Vincent Gable on November 11, 2009

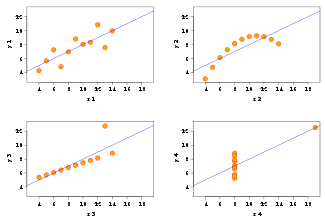
You’re looking at Anscombe’s quartet: 4 datasets with identical simple statistical properties (mean, variance, correlation, linear regression); but obvious differences when graphed.
325px-Anscombe.svg.png


(via Best of Wikipedia)

Graphs aren’t a substitute for numerical analysis. Graphs are not a panacea. But they’re excellent for discovering patterns, outliers, and getting intuition about a dataset. If you never graph your data, then you’ve never really looked at it.

War Story

I was working on optimizing color correction, using SSE (high performance x86 instructions). One operation required division — an expensive operation for a computer. The hardware had a divide instruction, but sometimes using the Newton-Raphson method to do the division in software is faster. You never know until you measure.

While doing the measurement, I somehow got the crazy idea to try both: I’d already unrolled the inner loop so instead of repeating the divide or Newton’s Method twice, I’d do a divide and then use Newton’s Method for the next value. Strangely enough, this was faster on the hardware I was benchmarking than either method individually. Modern hardware is a complex and scary beast.

I was fortunate enough to have a suite of very good unit tests to run against my optimized code. But there was a caveat to testing correctness. Because computers don’t have infinitely precise arithmetic, two correct algorithms might give different answers — but if the numbers they gave were close enough to the infinitely precise answer (say a couple ulps apart) it was good enough. (We can only be exact within some Tolerance!) The tests cleared my hybrid divide/Newton-Raphson function: but we couldn’t use it, because it was fundamentally broken.

Even though the error was acceptably small, it had a nasty distribution. Using divide gave color values that were a bit too light. Doing a divide in software gave values that were a bit too dark. Individually these errors were fine. Randomly spread over the image they would have been fine. But processing every other pixel differently had the effect of adding alternating light/dark stripes! We see contrast, not absolute color, so the numerically insignificant error was quite visible. Worse still, bands of 1 pixel stripes combined to form a shimmering Moiré pattern. It was totally busted. Unusable.

This was all immediately obvious when the results of the color correction were “graphed”. Actually looking at the answer caught a subtle error that our suite of unit tests missed.

To be clear, more subjective graphical analysis is not a substitute for numerical analysis and data mining. But I believe in actually looking at your data at least once. A graph is a kind of end-to-end visualization of everything, and that has value. Graphs are a cheap sanity check — does everything look right? And sometimes, they can give you real insight into a problem.

November 9, 2009

Spurious

What’s a spurious relationship?

Here’s one: People who eat ice cream are more likely to drown. Both incidence of ice cream eating and rates of drowning are related to summertime. The relationship between ice cream and drowning is spurious. That is, there is no relationship. Yet they appear related because they are both related to a third variable.

Lisa Wade

untitled5sk.jpg

(Image via the amazing Superdickery)

September 27, 2009

Python Programmers Don’t Get Laid Much

Filed under: Programming | , , ,
― Vincent Gable on September 27, 2009

Or Python Programmers are Wankers

Good recommendation systems are a win for everyone. But inevitably, they show correlations to undesirable products, and in that sense they also all give condemnations, which sometimes can be quite funny.

According to amazon.com, customers who bought a tube of Swiss Navy Cream Masturbation Lubricant also bought Learning Python, 3rd Edition,

CorrelationSmaller.jpg

Find Your Own

The only trick to finding a juicy “condemnation” is to start with something embarrassing to buy. Amazon has a filtering system, so regardless of how strong the correlation is, it shouldn’t ever show embarassing purchaces from the Learning Python book page. And even for systems without a filter, this approach maximizes your chances of finding something, since every recommendation from a disreputable product is a condemnation.

I’m not sure where the sweet-spot in popularity is for finding a condemnation.

If an item has fewer purchases overall, that should mean that it takes only a few purchases of it and X for X to be recommended. On the other hand, that means fewer items will be recommended from it.

Things can be too popular. Because Amazon only shows up to 100 recommendations, if an item has enough purchases, all of the recommendations from it will be so similar to it, that finding a “deviant” condemnation is impossible. Again I don’t know exactly where this popularity threshold is.

Good luck!

May 9, 2009

Words Lie More Than Statistics

Filed under: Quotes | , , , ,
― Vincent Gable on May 9, 2009

Increasingly it seems, people throw up their hands, “graphs and statistics are all lies anyway!” and never deeply examine quantitative information. And that’s part of the reason why I can’t recommend The Visual Display of Quantitative Information enough.

For many people the first word that comes to mind when they think about statistical charts is “lie.” No doubt some graphics do distort the underlying data, making it hard for the viewer to learn the truth. But data graphics are no different from words in this regard, for any means of communication can be used to deceive. There is no reason to believe that graphics are especially vulnerable to exploitation by liars; in fact, most of us have pretty good graphical lie detectors that help us see right through frauds.

Much of twentieth-century thinking about statistical graphics has been preoccupied with the question of how some amateurish chart might fool a naive viewer. Other important issues, such as the use of graphics for serious data analysis, were largely ignored. At the core of the preoccupation with deceptive graphics was the assumption that data graphics were mainly devices for showing the obvious to the ignorant. It is hard to imagine any doctrine more likely to stifle intellectual progress in a field…

–Edward Tufte, The Visual Display of Quantitative Information, page 53.

You will be lied to more often, and more subtly, with words than with figures. But unlike empty words, the data behind a chart is verifiable, and can be objectively redrawn. As I see it, quantitative analysis is our best chance to reason truthfully and without ego. Sometimes infographics are a better tool than words, especially for summarizing large datasets objectively. If anything, we should be scared when there aren’t graphs and statistics.

Powered by WordPress